Lourens Johannes Rothmann1,
Martha Susanna Lubbe1,
Jan Hendrik Philippus Serfontein1,
Jan Jakobus Gerber1,
Madeeha Malik1,2 ![]()
For correspondence:- Madeeha Malik Email: madeehamalik15@gmail.com Tel:+27793624335
Received: 13 September 2015 Accepted: 12 May 2016 Published: 28 June 2016
Citation: Rothmann LJ, Lubbe MS, Serfontein JH, Gerber JJ, Malik M. Prevalence of chronic diseases in private healthcare sector of South Africa: A threat to public health. Trop J Pharm Res 2016; 15(6):1327-1334 doi: 10.4314/tjpr.v15i6.28
© 2016 The authors.
This is an Open Access article that uses a funding model which does not charge readers or their institutions for access and distributed under the terms of the Creative Commons Attribution License (http://creativecommons.org/licenses/by/4.0) and the Budapest Open Access Initiative (http://www.budapestopenaccessinitiative.org/read), which permit unrestricted use, distribution, and reproduction in any medium, provided the original work is properly credited..
Purpose: To evaluate the prevalence of patients suffering from registered chronic disease list (CDL) conditions in a section of the South African private health sector from 2008 - 2012.
Methods: This study was a retrospective analysis of the medicine claims database of a nationally (South African) representative Pharmacy Benefit Management (PBM) company data between 2008 and 2012. Statistical analysis was used to analyse the data. Descriptive analysis was performed to calculate the prevalence of CDL conditions for the entire population, and stratified by age and gender. However, MIXED linear modelling was used to determine changes in the average number of CDL conditions per patient, adjusted for age and gender from 2008 - 2012.
Results: An increase of 0.20 in chronic diseases was observed from 2008 - 2012 in patients having any CDL condition, with an average of 1.57 (1.57 - 1.58, 95 % CI) co-morbid CDL conditions in 2008 and 1.77 (1.77 - 1.78, 95 % CI) in 2012. This increase in average number of CDL conditions per patient between 2008 and 2012 was statistically significant (p < 0.05), but with no large practical significance (d < 0.8).
Conclusion: Prevalence of patients with CDL conditions along with risk of co-morbidity has been increasing with time in the private health sector of South Africa. Risk of increased co-morbidity with age and among different genders was prevalent.
Introduction
Chronic non-communicable diseases (NCDs) such as diabetes, cardiovascular disease (CVD) and cancers pose a major public health threat worldwide. According to an estimate by WHO by 2020, one-third of the global burden of disease will be attributable to chronic diseases [1]. Nearly one-third and 44 % of the deaths before age 60 are due to chronic diseases in middle-income and low income countries, respectively. Various risk factors including unhealthy diets, physical inactivity, alcohol consumption, poor knowledge of health workers, low quality services and lack of access to medicines have been identified towards contribution of burden of chronic diseases [2]. This rise of burden of chronic diseases in turn has led to high costs of illness and potentially significant productivity losses [3].
The burden of non-communicable diseases as well as multi-morbidity, the co-existence of more than one chronic condition in one person, is particularly rising in Africa. According to the study conducted by The Global Burden of Disease, HIV ranks first, TB fourth, cerebrovascular disease seventh, diabetes eighth while non-communicable diseases contribute to fifty percent causes of morbidity in South Africa [4]. An estimated increase from 11 to 13 % and 3.2 to 4.0 % since 2009 to 2025, for CDL conditions and multi-morbidity is anticipated [4]. The current situation of increased burden of chronic diseases is a major challenge to existing models of healthcare delivery systems in South Africa. Thus, it is important to recognise such illnesses and strategize appropriately to address them at individual patient care level [5].
To address this dilemma, the South African Council for Medical Schemes formulated a chronic disease list (CDL) including the most common, life-threatening diseases. These conditions fall under a larger group, called prescribed minimum benefits, defined as a set of benefits to ensure that all medical scheme members have access to certain minimum health services; regardless of the benefit option they have selected [6,7]. This has created a positive impact on prescribing practices carried in private healthcare facilities. But, still limited data exists on assessing the prevalence of these particular combinations or clusters of chronic conditions, as most of the studies conducted so far in South Africa have been focused on comorbidities of a specific disease.
Thus, the present study was designed to evaluate the prevalence of patients suffering from registered chronic disease list (CDL) conditions in a section of the South African private health sector from 2008 - 2012.
Methods
This study was a retrospective analysis of the medicine claims database of a nationally (South African) representative PBM company data between 2008 and 2012.Approval was obtained for the study from the appropriate Pharmacy Benefit Management companies (PBM) as well as from the Ethics Committee of the North-West University (Human, Potchefstroom campus) (no. NWU-0046-08-A5) to conduct this drug utilisation study. The PBM Company provides services to four capitation providers, thirty-two medical schemes and four sick benefit society funds. The medicine benefits of approximately 1.6 million beneficiaries are maintained annually by the PBM company.
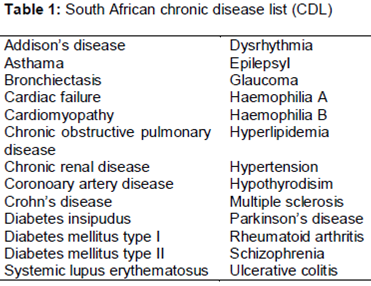
The data fields used in this study include: quantity of medication claimed, member gender, member date of birth, NAPPI code, ICD-10 code, diagnose code, active pharmacological ingredient of the medication, number of prescriptions dispensed containing medication used to treat CDL conditions and period in which the item was dispensed. The chronic conditions included in this paper are listed ().
Analyses were performed on patient level. The prevalence of each condition was calculated by dividing the number of patients with the condition by the number of active patients. Statistical Analysis System®, SAS 9.3®and Statistical Package for the Social Sciences (IBM SPSS® 22) were used to analyse the data. Descriptive analysis was performed for calculating the prevalence of CDL conditions for the entire population and stratified by age and gender. MIXED linear modelling was used to calculate average number of CDL conditions per patient for the influence of age and gender differences so that the same patients prevalent in 2008 remained also prevalent in 2012. These also involved patients that have either entered or left the medical scheme for any reason or came into the medical scheme any time during the study period under consideration.
Results
Prevalence of patients with at least one CDL condition
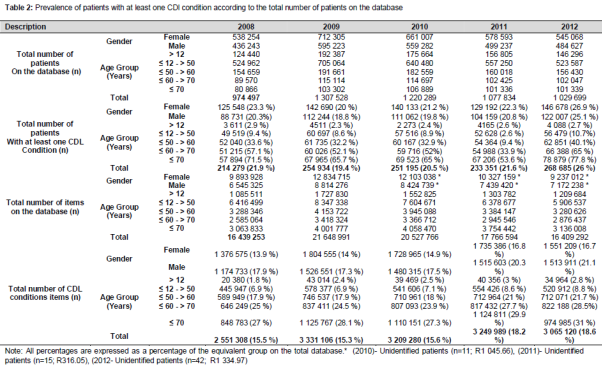
The total number of patients on the database were 974,497 patients in 2008, 1,307,528 in 2009, 1,220,289 in 2010, 1,077,834 in 2011 and 1,029,699 patients in 2012. Patients with at least one CDL condition represented 21.9 % (n = 214 279) of the total number of patients on the database in 2008, and they increased to 26 % (n = 268 685) in 2012. The representation of female patients with at least one CDL condition increased from 23.3 % (2008) to 26.9 % (2012) and those of male patients from 20.3 % (2008) to 25.1 % (2012).There was an increase in the number of patients with CDL conditions across all age groups except for age group ≤ 12 year with a decrease from 2.9 % (2008) to 2.7 % (2012). The other age groups: 12 > age ≤ 50 years increased from 9.4 % (2008) to 10.7 % (2012); 50 > age ≤ 60 years increase from 33.6 % (2008) to 40.1 % (2012); 60 > age ≤ 70 years increased from 57.1 % (2008) to 65 % (2012) and age > 70 years from 71.5 % in 2008 to 77.8 % in 2012. A detail summary is given ().
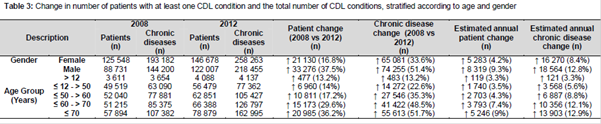
The estimated annual increase was also higher for male patients and their associated CDL conditions. All age groups had their highest prevalence in 2012, except for age groups less than 12 and 12 to 50 years. Age group > 70 years had the highest prevalence of patients in all the age groups for the study period in 2012 with 29.3 % (n=78 879). The largest increase in the number of patients with at least one CDL condition were between 2008 and 2012 was for age group > 70 years (36.2 %; n = 20 985) and for chronic conditions (group > 70 years; 51.7 %; n=55 613). Age group > 70 years, thus had the highest estimated annual patient increase of 9 % (n=5 246) and estimated increase in number of CDL conditions of 12.9 % (n=13 903) ().
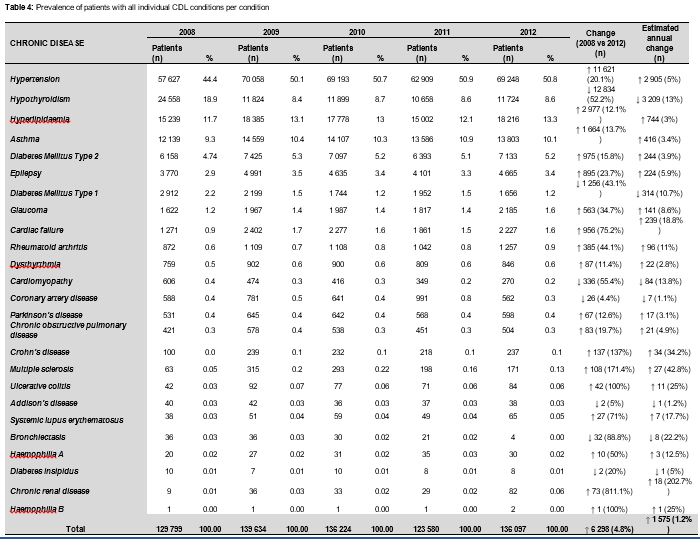
Of all the CDL conditions, hypertension had the highest contribution during each of the study years followed by hyperlipidaemia. All 26 conditions, had a patient increase of 139 336 with an estimated annual increase of 34 834. The total number of patients increased by 41.3 % (n = 139 336) between 2008 and 2012 with an estimated annual increase of 10.3 % (n = 34 834). All CDL conditions except bronchiectasis had an overall increase in the number of patients from 2008 until 2012, hypertension had the highest increase (n = 49 531), followed by hyperlipidaemia (n = 35 490) and diabetes mellitus type 2 (n = 17 120). Bronchiectasis had an overall decrease between 2008 and 2012 of 38 patients. The prevalence included patients with a single CDL condition or in combination with other CDL conditions. Diabetes insipidus had the lowest patient increase (n = 3) between 2008 and 2012 ().
Changes in the number of CDL conditions, adjusted for influence of age and gender
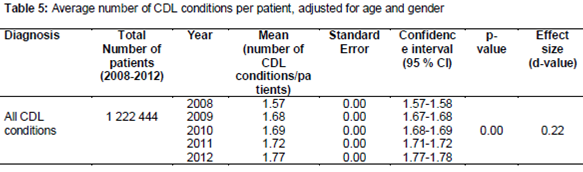
An increase of 0.20 in chronic diseases was observed since 2008-2012 in patients having any CDL condition with an average of 1.57 (2008) co-morbid CDL conditions to 1.77 in 2012. This difference in increase in average number of CDL conditions per patient between 2008 and 2012 was of statistical significance (p < 0.05), but no large practical significance (d<0.8) ().
All of the CDL conditions had increases in the average number of co-morbid CDL conditions per patient: however, glaucoma, haemophilia B and bronchiectasis were the only CDL conditions with an increase in co-morbid CDL conditions per patient of large practical significance (d>0.8). Asthma (increased by 0.18 co-morbid CDL conditions), hyperlipidaemia (increased by 0.20), hypertension (increased by 0.16), hypothyroidism (increased by 0.67) and diabetes mellitus type 2 (increased by 0.24). Addison’s disease (increased by 0.23), coronary artery disease (increased by 0.25), cardiac failure (increased by 0.14), multiple sclerosis (increased by 0.92), Parkinson’s disease (increased by 0.25) and chronic obstructive pulmonary disease increased by 0.17 CDL conditions per patient between 2008 and 2012. The CDL condition with the smallest increase in CDL conditions per patient was for schizophrenia with 0.08 and the highest increase for patients with bronchiectasis with 1.07 CDL conditions per patient.
Epilepsy, glaucoma, haemophilia A and haemophilia B had increases of 0.17, 0.15, 0.29 and 0.50 respectively between 2008 and 2012. The only CDL condition with an overall decrease of 0.21 in average number of CDL conditions was chronic renal disease. The CDL condition with the highest number of co-morbid CDL conditions was chronic renal disease with 3.54 in 2008 to 3.37 in 2011. Cardiomyopathy had the highest average number of CDL conditions per patient during 2012 with 3.36. Average number of co-morbidities with hypothyroidism had an overall increase from 2008 with 1.67 to 2012 with 2.34.
Discussion
Chronic Diseases List conditions play a vital role in the consumption of health resources, not only due to the number of patients increasing but also the financial impact on medical schemes, patients and other resources. The present study reported continuous increase of total number of patients with at least one CDL over time. This might be attributed to chronic disease related lifestyle risk factors, increased registration of CDL conditions by medical scheme beneficiaries and increase in the number of medical scheme beneficiaries as reported by the pharmaceutical benefit company used in this study. Similar increased burden of disease associated with chronic conditions was reported by a study conducted in twenty three different countries [8].
The current study reported higher prevalence of CDL conditions in female patients as compared to male patients since 2008 to 2012. Higher prevalence of non-communicable disease in females was also reported by other studies conducted in South Africa and Germany[9,10]. Findings from another study conducted in United States reported higher prevalence of co-morbid chronic conditions in females as compared to males [11].
The present study found an increase in CDL conditions proportionate to increase in age. This might be due to the fact that people live longer than before. According to a survey, one in twenty people were aged 65 years and older a century ago, however, the proportion was one in six in 2011 and it has been estimated that by 2050, the proportion will be one in four with chronic disease. This situation will lead to an increase risk of CDL conditions such as hypertension, hyperlipidaemia and diabetes associated with aging [8]. The results of conducted in the United States showed that prevalence of co-morbid chronic conditions increase with increase in age. Higher prevalence of non-communicable diseases in elderly was also reported by another study conducted in South Africa [12].
It has been estimated that deaths associated with all chronic diseases globally, may increase from 61 % of the total disease burden in 2005 to 71 % in 2030.On the other hand, deaths from cardiovascular disease and chronic respiratory disease may increase from 33 to 36 % and 8 to 12 % of the total disease burden by 2030 [8]. The findings of the current study revealed that chances of co-morbidities in individual patients with a CDL condition are high. Chronic renal disease was the only CDL condition with patients having an overall decrease in co-morbidity, although the average was still higher than the other conditions over the majority of the study period. This higher co-morbidity prevalence might be due to associated risk factors, such as hypertension, diabetes mellitus type 2 and obesity.
The high average number of co-morbid CDL conditions for coronary artery disease, may be attributed to diabetes mellitus type 2 and hyperlipidaemia, as being most commonly prevalent CDL condition [13].The present study reported hypertension and hyperlipidaemia among the top three most prevalent chronic diseases. These results are in line with similar findings from another study conducted in South Africa [14]. Another study conducted in United States confirmed hypertension and hyperlipidaemia currently as the most prevalent chronic diseases [15].The increase in burden of chronic diseases will result in use of complex drug regimens which in turn will not only increase cost of therapy but will also promote issues related to unwanted side effects, drug-drug interactions, resistance and patient non-compliance.
Limitations of the study
The results of the study are based on the data from the medicine claims database of a nationally (South African) representative PBM company and might not be generalized to the entire country.
Conclusion
The prevalence of patients with CDL conditions along with risk of co-morbidity has been increasing with time in private healthcare sector of South Africa. Individual patients with any of the CDL conditions acquired on average at least one additional CDL co-morbidity (except for chronic renal disease), especially, when other CDL conditions were known as risk factors. Risk of increase co-morbidities with age and among different genders was prevalent. The current situation will easily overwhelm healthcare system as awareness regarding the magnitude and consequences of increased chronic disease burden as well as the capacity to respond appropriately with cost-effective measures is still low. Thus, this calls for more extensive research to recognise and accommodate the impact of the increased chronic disease burden to address this public health concern appropriately, especially in the private healthcare section of South Africa.
Declarations
Acknowledgement
References
Archives


News Updates